I want to share my experience with profiling tectonic on Ubuntu 17.04 using perf. While it is probably too early to optimize the code, and tectonic is definitely not slow, I was curious how much overhead the Rust IO bridge adds on top of XeTeX.
Setup
First, we need to compile tectonic with debug info and frame pointers to be able to call graphs. You can use my branch profile.
In Cargo.toml, add
[profile.release]
debug = true
and add -fno-omit-frame-pointer flag to gcc in build.rs by adding lines
    ccfg
        ...
        .flag("-fno-omit-frame-pointer")

    cpcfg
        ...
        .flag("-fno-omit-frame-pointer")
Profiling
Compile with cargo build --release and use perf to record the profiling data:
perf record -F 9997 -g -- target/release/tectonic tests/xenia/paper.tex
You might have to use sudo. Warning: Sometimes perf completely freezes my system, not even Linux consoles work and hardware reset is needed, so save your work before running.
Option -g -- asks perf to produce a call graph. -F 9997 is a sampling frequency that seems to work well in my case.
To see the data, run
perf report
Again, sudo might be needed.
Unfortunately, the report is not super readable.
Flame graph
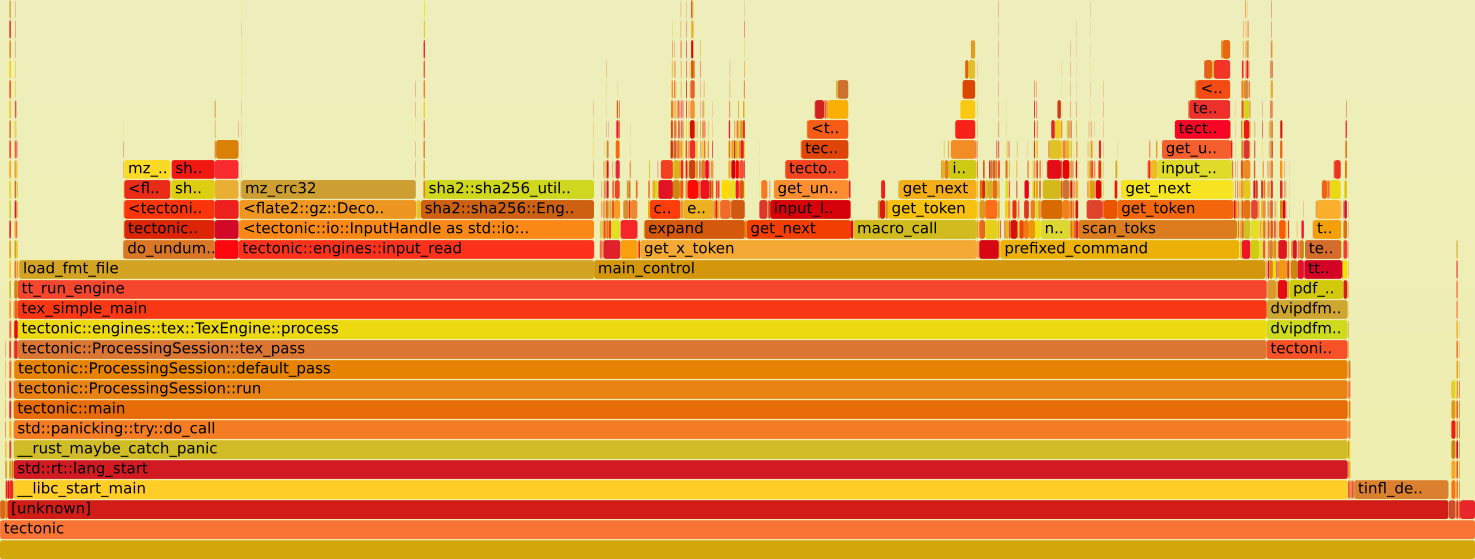
FlameGraph can be used to produce a nice graph like this:
Just download stackcollapse-perf.pl and flamegraph.pl, put your on your $PATH and run
perf script | stackcollapse-perf.pl | flamegraph.pl > graph.svg
(sudo might be needed again.)
Open graph.svg in your browser (Firefox works well) for some interactive goodness.
Performance
The not so good news is that indeed a lot of time is spent in engines::input_read, cca. 35% of the total run time. load_fmt_file itself takes 40% of the total run time. The good news is that there is a lot of low hanging fruit for a speed up. For instance, the engine state after loading a format file could be cached for consecutive runs, input IO could be buffered on the C side, etc.
